
Introduction to Execution Plans
Every time we submit a query to sql server, it has to try and figure out the most efficient way to retrieve the data we are asking for. It uses the information it holds about the data such as statistics and indexes to work out an optimal way to retrieve the data.
We can view the estimated execution plan by either pressing ctrl+L or by highlighting the Display Execution Plan button within SSMS . The estimated button is highlighted on the left and the Actual button is the one on the right shown below.
Lets walk through an example of a ‘trivial’ execution plan by using a simple select statement with no filtering by running the following query against the AdventureWorks database:
Select * from Person.Person
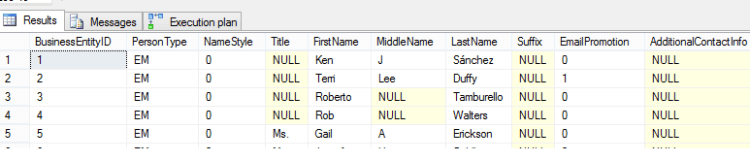
This results in the following output in ssms. A total of 19972 rows are returned – I’ve only shown the first 5 for the sake of space. Notice the tab named ‘Execution plan’
Clicking the Execution plan tab reveals the following…
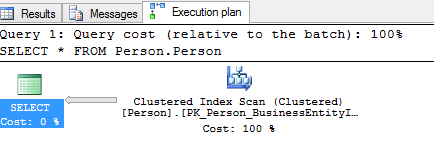
Let’s break this graphical execution plan down !
The first thing to note is the ‘Query cost (relative to the batch) : 100%’ – This is indicating that sql worked out that because there was only 1 batch, our select, then 100% of the cost of working out the best plan and optimisation was spent on this one batch – makes perfect sense – and we will see later how this works when there are more than 1, or more batches to process. Also notice the arrow pointing away from the clustered index scan towards the select statement. This is indicating the directional flow of the data through the various operators (in this simple example there are no further operators between the 2 icons). The thickness of the arrow too is an indication of how much data is flowing. Thick arrows can often be a big visual clue that maybe there is too much data being selected and may benefit from filtering.
The next thing to look at is the blue icon labelled ‘Clustered index scan’ – This tells us that to return the data we asked for, (remember we asked for EVERYTHING from the table) then sql server decided the quickest method would be to scan the entire index – essentially scanning the whole table (or clustered index in this case) to retrieve the data. Another common operator we see here is the ‘Table Scan’.

This is exactly the same as a clustered index scan except the table is scanned when no clustered index is present, in which case the table is classed as a ‘Heap’. Both are generally considered bad for performance.
We would not typically want to be seeing ‘Select *’ statements in an production environment, and if you do, hunt down the person who is writing such bad queries and politely tell them to stop – or not so politely if it makes you feel better !!!!
Let’s see if we can improve the query by adding a filter – remember the following mantra and you will live long and prosper – “Select only what data you need”
Select * from person.person
where BusinessentityID < 10
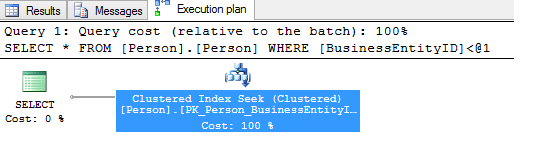
This results in the following result set and execution plan:
KEY LOOKUPS – A Performance killer
One of the more common quick wins in terms of improving performance from your queries can be to remove the keylookup or ‘bookmark’ lookup from your execution plans
What exactly is a key lookup then ? Well, simply put, a key lookup is necessary whenever a query has to get it’s data from the clustered index (or if its heap the base table), when the non clustered index used did not completely satisfy the query. This causes extra i/o and can be quite easily avoided if the non clustered index used was said to be ‘covering’ the query.
Lets look at an example of this in action.
I’m using the the adventure works database on a sql2012 instance.
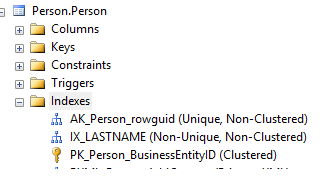
First lets make sure we have a non clustered index that our query can use. Here we have created a non clustered index called IX_LASTNAME on the person.person table
Now let’s run the following query
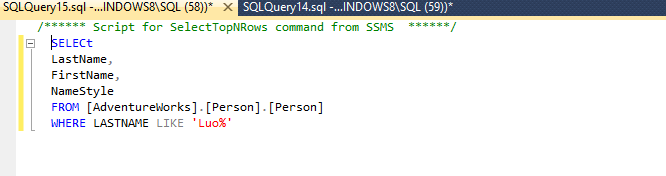
The output from the execution plan tab looks like below
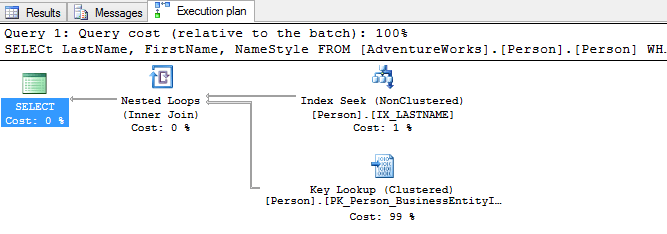
Looking at the above execution plan, we can clearly see that the Key Lookup is where the majority of the cost of the query is occurring. This can easily be removed by adding a covering index.
If you hover your mouse over the key lookup icon a tool tip will appear, and it will show you what columns need adding if you look at the ‘output list’ highlighted below.
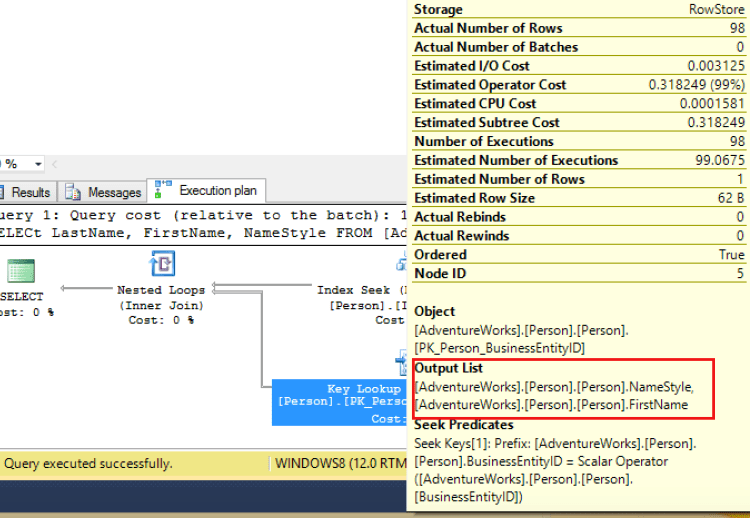
What the above is telling us, is that if if we add the columns NameStyle and FirstName as included columns of the non clustered index IX_LASTNAME, then the Key Lookup operator will be removed from our execution plan. Let’s check this out.
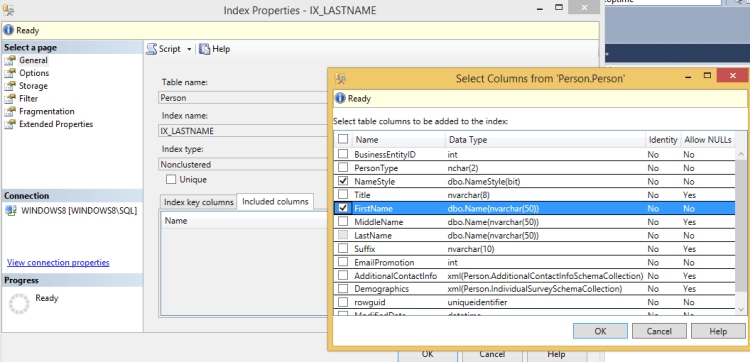
First we need to modify our index. An easy way to do this is by right clicking the index and selecting properties, the clicking on the ‘included columns’ tab. Here we can add the required columns to our index as shown below.
Now let’s re run our query with the show Actual Execution plan button selected and check out the new plan generated.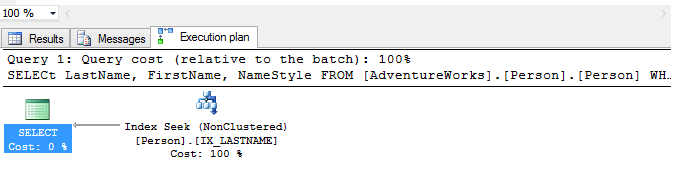
As we can now see above, the query produces the favoured index seek and the Key Lookup has been removed from the execution plan. This will aid performance and is a relatively easy fix to implement.
Hope you found this useful !
