
How to Capture Blocking Info
Whenever you have blocking on a server it is important that you are able to gather the information for analysis to enable you hopefully prevent further occurrences. There are various ways to monitor this such as Extended Events, but here is a method I use which I think is a good method to capture blocking events for analysis at a later date.
The first thing you need to do is set the ‘blocked process threshold’ because by default, sql server does not generate a report when this event occurs. If you want a blocked process report to be generated after 20 seconds of blocking you need to first alter the server default.
sp_configure ‘show advanced options’, 1;
go
RECONFIGURE;
GO
sp_configure ‘blocked process threshold’, 20 ;
go
RECONFIGURE;
GO
Next we are going to create an WMI event alert which will trigger whenever the 20 second threshold we defined above occurs.
The script to create this alert is here…..create-blocking-alert-sql
If you go to the ‘ALERTS’ section under sql server agent you should see the following.
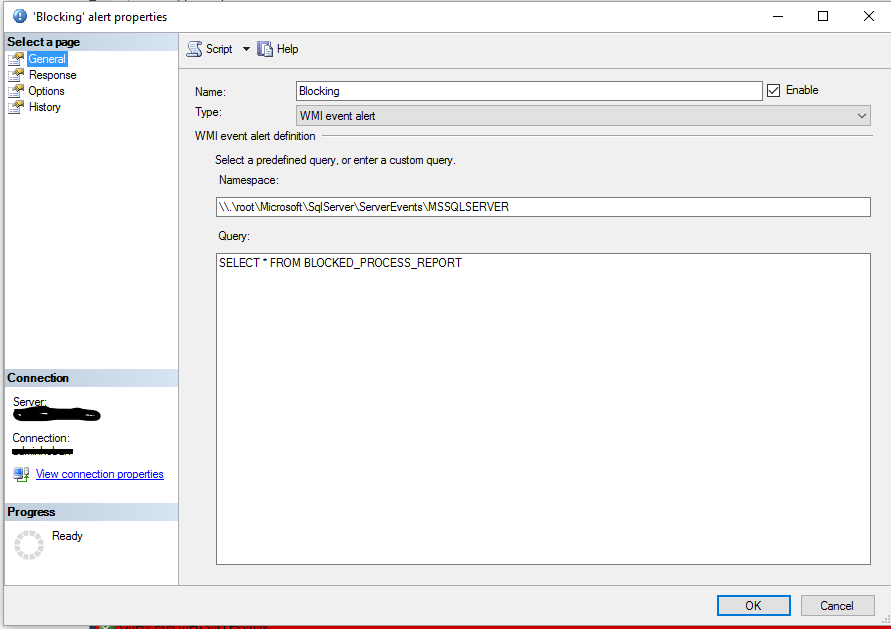
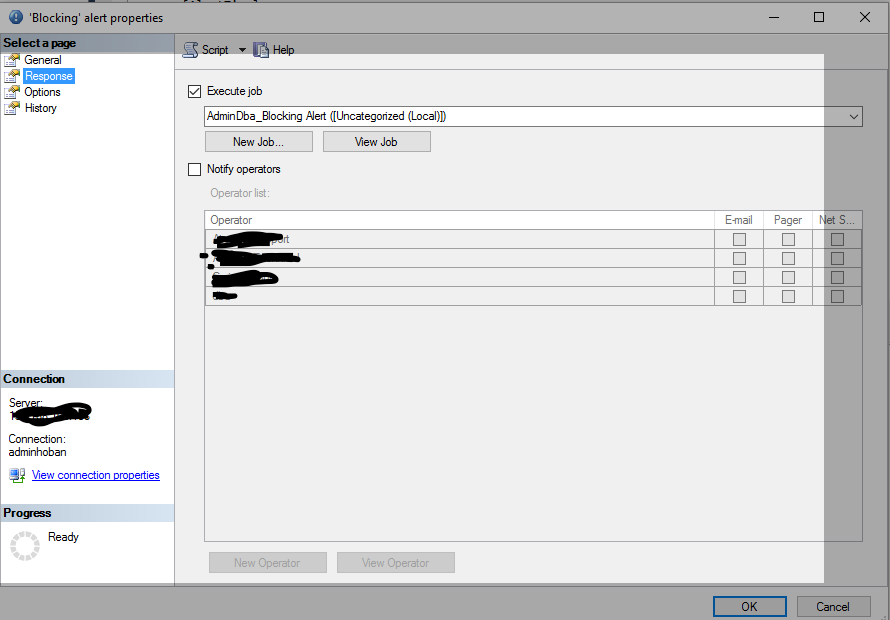
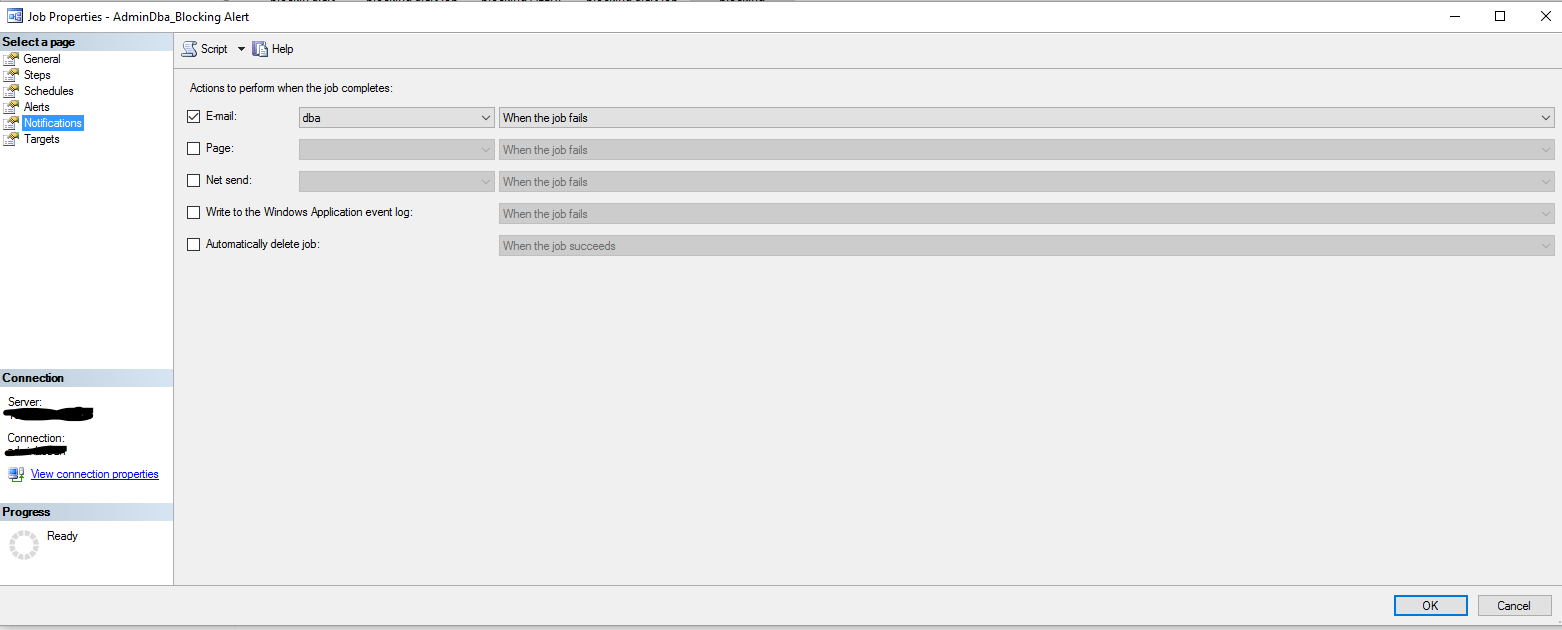
The alert when fired after a blocking condition of 20 seconds or more, will then in turn fire a sql server agent job which will gather the blocking info and log it into our table which we will now create in our dba database that we use to gather important dba type activity.
The script to create the table is here….create-table-blockedevents-sql This will create a table called ‘BlockedEvents’
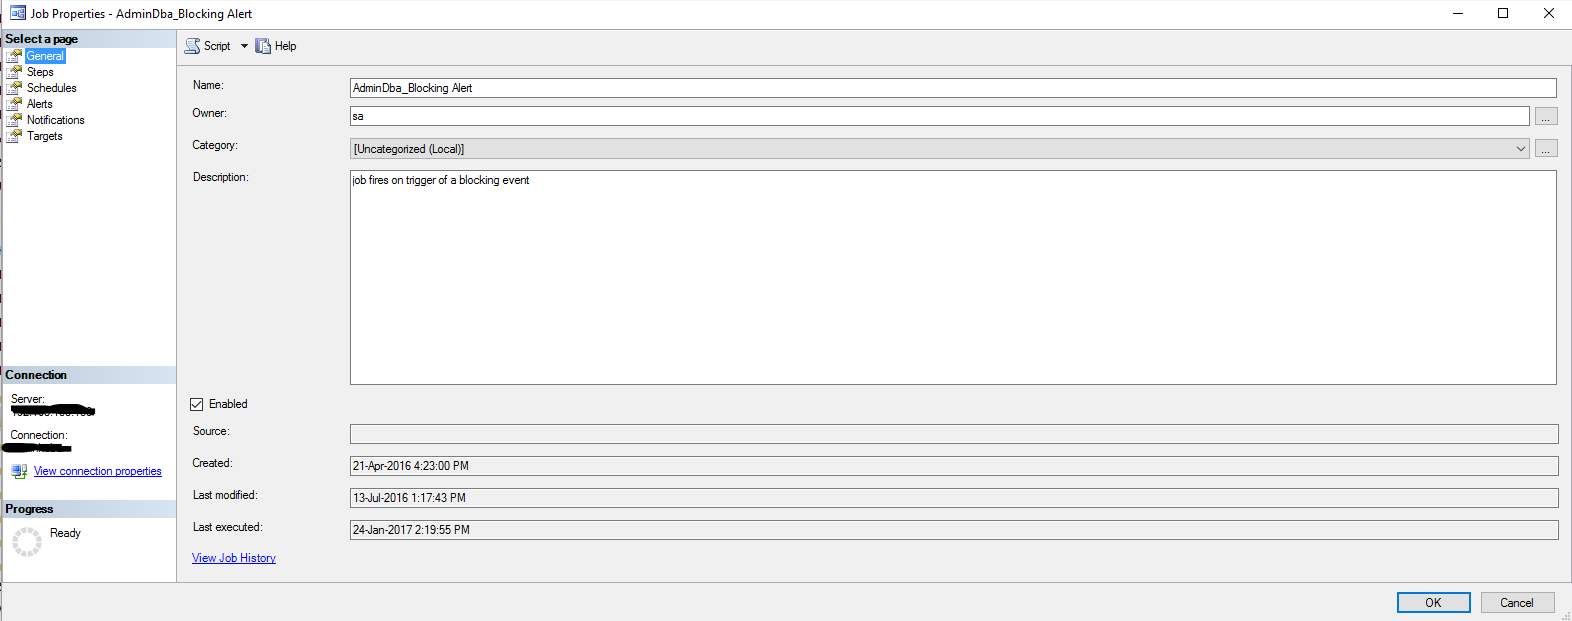
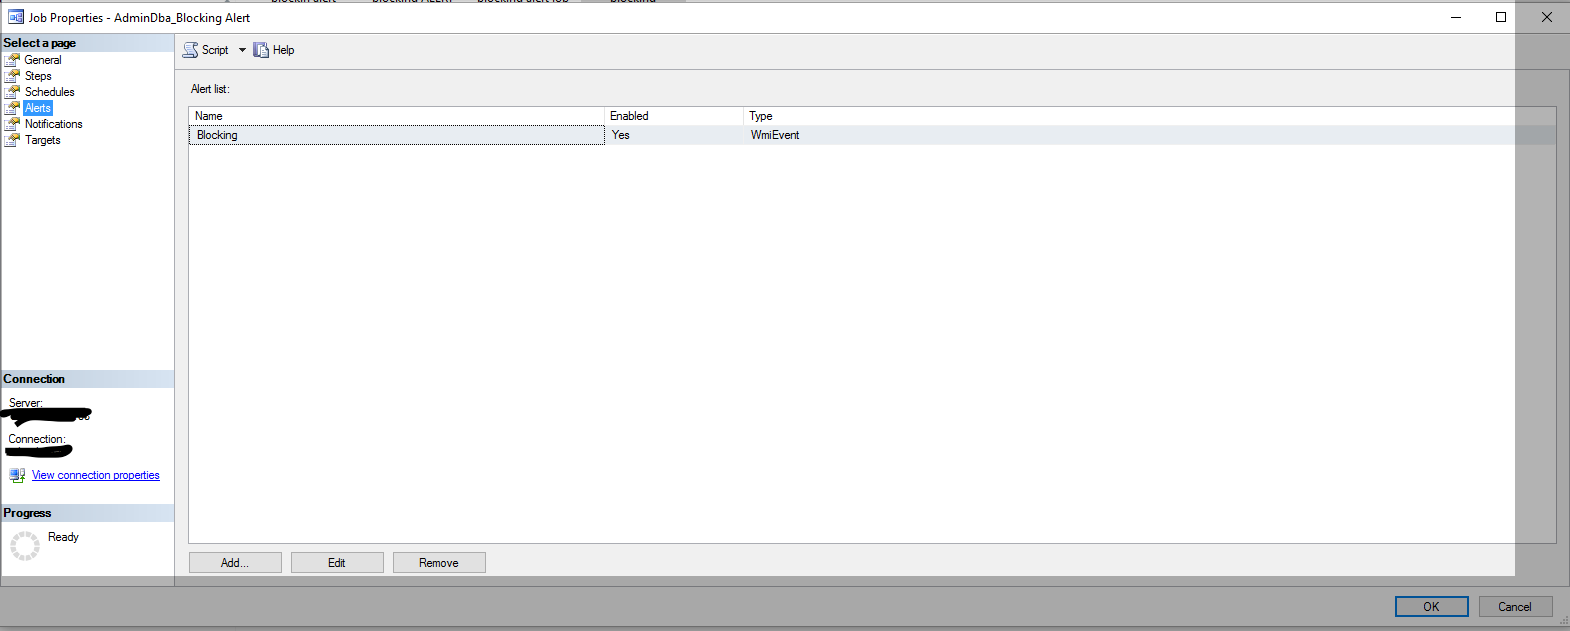
Once the table is created, we need to create the sql server agent job that runs once the alert fires.
The script to create the job is here…create-job-that-fires-when-blocking-alert-is-triggered-3-2-sql
This will create a sql server agent job which looks like this….

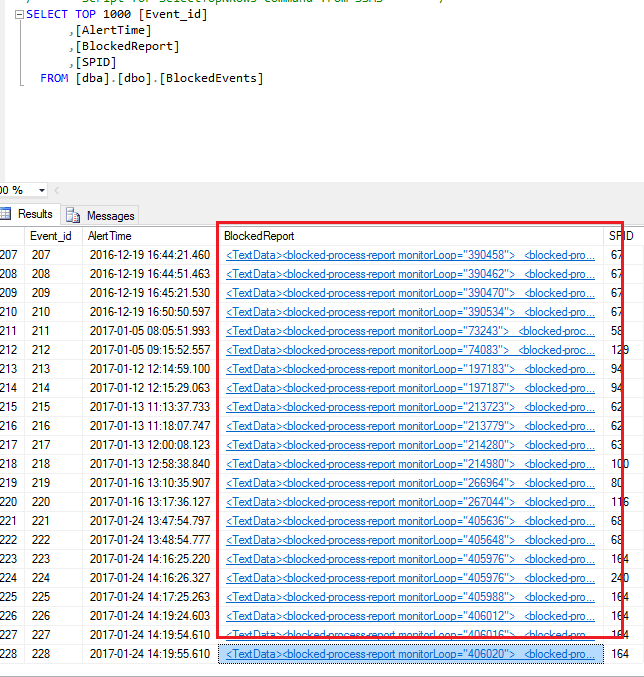
So now we should have the ability yo capture blocking info into a table. Once some blocking has occurred if we query our BlockedEvents table we will see in the results panel a link which when clicked opens up an XML document, which shows us a wealth of information.
Highlighted within the yellow section are the details of the actual process that was blocked.We can see information such as wait resource, wait time and isolation level of the transaction. We also get the statement that was being blocked. In this example its an INSERT into tableA (COLA,COLB,COLC,COLD,COLE….COLX) Values (‘982′,”,’5’,’30’…..)
Highlighted within the green section we see the blocking process with similar information. We also get the ‘sqlhandle’ that, with a little tsql manipulation will hopefully show us the execution plan of the queries involved.This may reveal a missing index or show us where to spend our time tuning the query to prevent blocking.
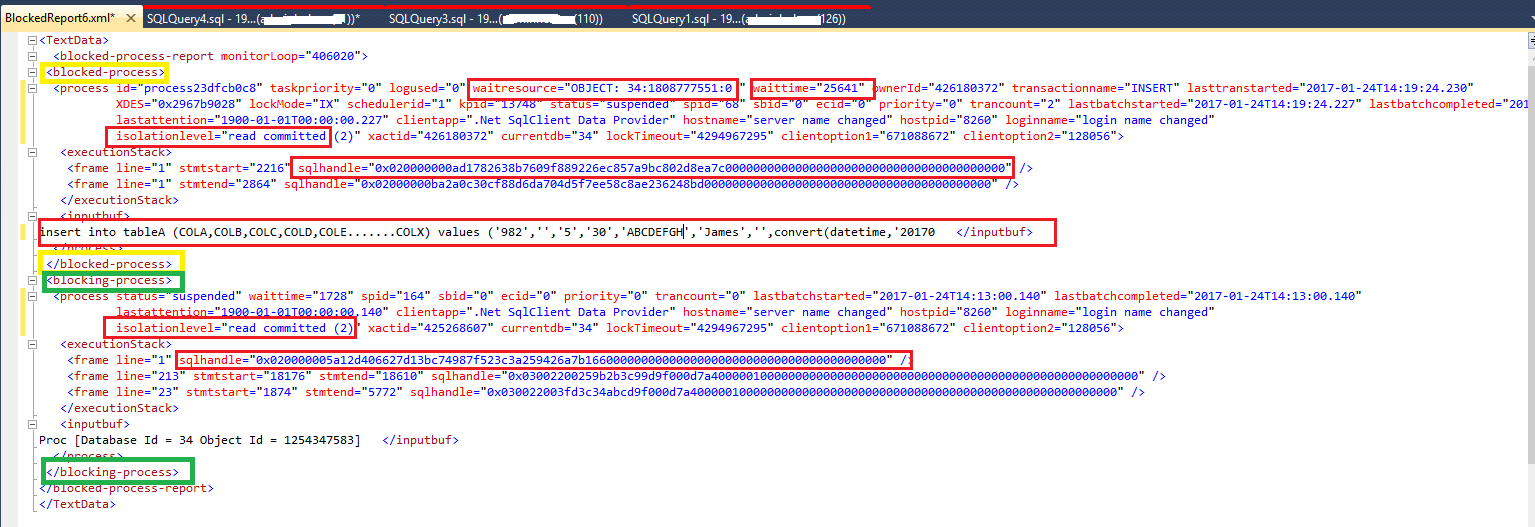
In the coming weeks I will walk through the xml report and show how we can get the execution plan from the sqlhandle providing it has not been aged out of the plan cache.
