
One of the most important things that any dba needs to do is to start gathering the key sql server metrics for use as reference when things start to change in the system. Now it should be pointed out that I am indeed reinventing the wheel here, because there are lots of third party monitoring and alerting tools that can do a far better job than what I am presenting within this article. However, If your company cannot afford such products (and there are many !) and also if you are a dba that prefers his/her own solution (and there are many) then you may find this article of some use.
The Value of A Baseline
It could be that the developers just released a new version of the application and now the end users are saying ‘its slow’. Well, if you don’t have a baseline to compare the system from before the software release to after the release you have no way of knowing if things have indeed slowed down.
For example, it could be that after the release the lock waits/second metric have increased dramatically and maybe there is an index on a particular table that is crying out to be created. If you where capturing the lock waits/second metric for a long enough period before the release you now will be able to see the difference and start your investigation – or get the developers to role back the software if the slow down is dramatic enough. You will have evidence to produce to management to show the before and after picture and take the appropriate action.
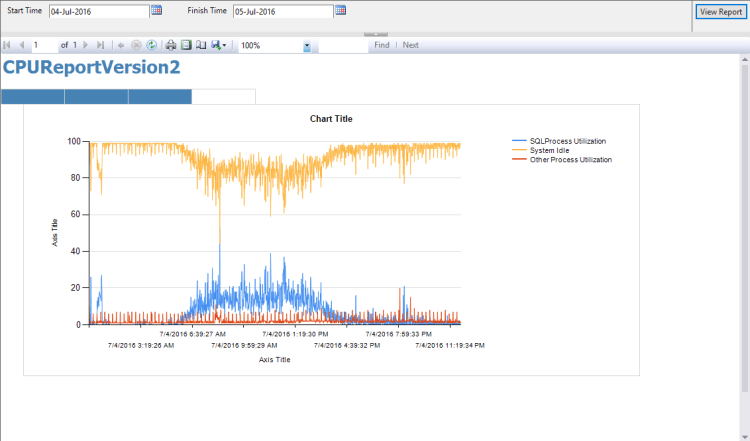
In this post, I will demonstrate how easy it is to capture metrics and set up your own monitoring system. Once we have the metrics collected, I will show you how easy it is to then display the data in a graph format using Microsoft Visual studio or SSRS. It is so much easier to see your baseline, and any variances from the norm, when the data is displayed in a graph format. Plus management always love a nice graph ! As an example of what is achievable, take a look at the screen shot below which shows SQL Server CPU usage in blue, System Processor usage in yellow, and the System Idle metric in red. This was done by gathering the data into a table and then using SSRS to query the table.
 As you can see, this makes for a great reporting facility and gives you a clear view of where your baseline lies, showing you spikes, and deviations away from what you would class as a normal value.
So without further ado, lets look at creating this.
Create your SQL Server CPU Report
The first thing we need to do is to start regularly gathering the data for sql server, system, and system idle processor times.
Now as always, I am not going to take credit for scripts that I have not personally created. The following script was cerated by Benjamin Nevarez – here is the link to the original article Benjamin Nevarez. You will see I have modified the query so it inserts the results into our table, and then using the MERGE statement, when the script is run again, it adds only the new records to our table. There may be a better way to do this but this method worked for me. Feel free to comment !
Here are the scripts you need to get this up and running
Script1 –Create SP to gather cpu info.sql
Script2 – Create Table CPU_USAGE.sql
Once you have created the stored procedure (I am presuming that you have also created your own Database Administrator database to gather such information) and table then you just have to create a job that runs every x minutes that executes the stored procedure. I run my job every 20 minutes.
The results from the table will look like the below picture.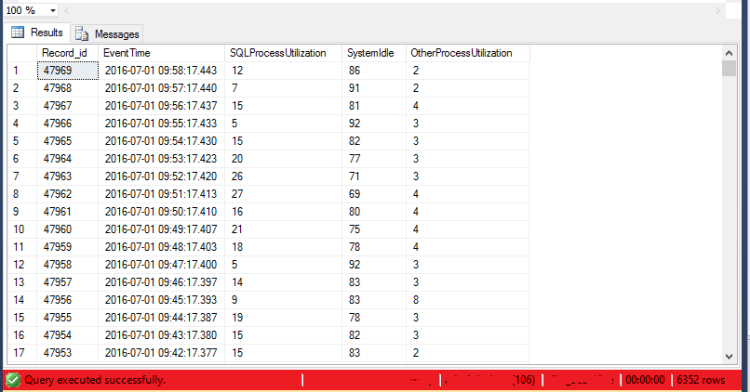
I also gather some other key sql server metrics into another table called PerfMonData The reason for another table is basically just because I added the cpu metric later on and found it easier to separate the 2 sets of data out. You may wish to try and combine the results into one table but that will be left as an exercise for the reader – this method works so it’s what I use.The metrics that we will sample in our other second table are:
| SQLServer:Access Methods:Forwarded Records/sec: |
| SQLServer:Access Methods:Full Scans/sec: |
| SQLServer:Access Methods:Index Searches/sec: |
| SQLServer:Buffer Manager:Free list stalls/sec: |
| SQLServer:Buffer Manager:Lazy writes/sec: |
| SQLServer:Buffer Manager:Page life expectancy: |
| SQLServer:Buffer Manager:Page reads/sec: |
| SQLServer:Buffer Manager:Page writes/sec: |
| SQLServer:Buffer Node:Page life expectancy:000 |
| SQLServer:Databases:Transactions/sec:_Total |
| SQLServer:General Statistics:User Connections: |
| SQLServer:Latches:Latch Waits/sec: |
| SQLServer:Locks:Lock Waits/sec:_Total |
| SQLServer:Locks:Lock Waits/sec:AllocUnit |
| SQLServer:Locks:Lock Waits/sec:Application |
| SQLServer:Locks:Lock Waits/sec:Database |
| SQLServer:Locks:Lock Waits/sec:Extent |
| SQLServer:Locks:Lock Waits/sec:File |
| SQLServer:Locks:Lock Waits/sec:HoBT |
| SQLServer:Locks:Lock Waits/sec:Key |
| SQLServer:Locks:Lock Waits/sec:Metadata |
| SQLServer:Locks:Lock Waits/sec:Object |
| SQLServer:Locks:Lock Waits/sec:OibTrackTbl |
| SQLServer:Locks:Lock Waits/sec:Page |
| SQLServer:Locks:Lock Waits/sec:RID |
| SQLServer:Locks:Number of Deadlocks/sec:_Total |
| SQLServer:Locks:Number of Deadlocks/sec:AllocUnit |
| SQLServer:Locks:Number of Deadlocks/sec:Application |
| SQLServer:Locks:Number of Deadlocks/sec:Database |
| SQLServer:Locks:Number of Deadlocks/sec:Extent |
| SQLServer:Locks:Number of Deadlocks/sec:File |
| SQLServer:Locks:Number of Deadlocks/sec:HoBT |
| SQLServer:Locks:Number of Deadlocks/sec:Key |
| SQLServer:Locks:Number of Deadlocks/sec:Metadata |
| SQLServer:Locks:Number of Deadlocks/sec:Object |
| SQLServer:Locks:Number of Deadlocks/sec:OibTrackTbl |
| SQLServer:Locks:Number of Deadlocks/sec:Page |
| SQLServer:Locks:Number of Deadlocks/sec:RID |
| SQLServer:Memory Manager:Target Server Memory (KB): |
| SQLServer:Memory Manager:Total Server Memory (KB): |
| SQLServer:SQL Statistics:Batch Requests/sec: |
| SQLServer:SQL Statistics:SQL Compilations/sec: |
| SQLServer:SQL Statistics:SQL Re-Compilations/sec: |
Here are the scripts to gather the Sql metrics and create the table to log the values into.
Script3 – Script to gather Sql Metrics Script3
Script4 – Script to create table to log data into Script4
You can create a job that runs every x minutes that executes the Tsql code. You will now have 2 tables, one collecting the cpu metrics for your server, and the other gathering all the above sql perfmon metrics.
Again we can query the results using SSRS to produce something that looks like the below:
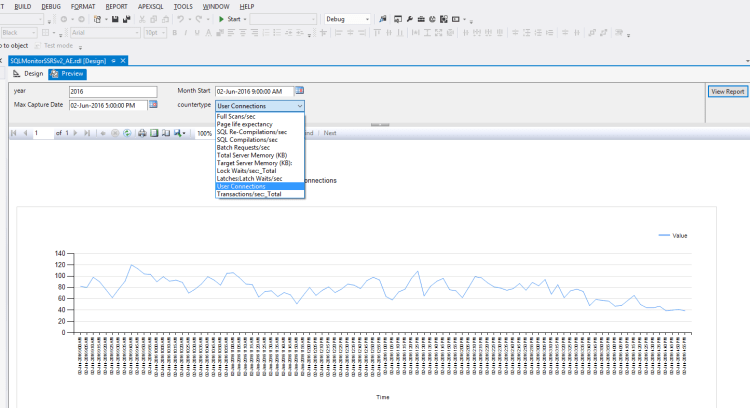

Once this is in place, you can select a date range from the date picker and look for any abnormalities – especially good for when you are experiencing a performance problem.
Creating the SSRS Visual Report for CPU Monitoring
Now I am by no means an expert in SSRS or visual studio and I managed to create the above with little effort and a big of googling. You may well very familiar with SSRS and be able to produce something much more funky but hopefully this article is showing you just what can be done with a little effort.
I used Visual Stuido Studio 2012 Shell (Integrated) version 11.0.50727.1 if that info is of any use to you !
Within Visual Studio
File – new – Report Server Project and give the report an appropriate name.
Click Ok.
Within Solution explorer on the right hand side of the GUI right click the ‘Reports’ icon and choose ‘Add New Report’ – The ‘Welcome to the Report Wizard’ opens, click Next.
Select ‘New data source’ and give it an appropriate name. Make sure Type is Microsoft SQL Server and click on edit to enter a logon with appropriate permissions to connect and then choose your database where you will be storing the info. Click on ‘Test Connection’
If Test connection succeeded message appears click ok, and ok again then Next.
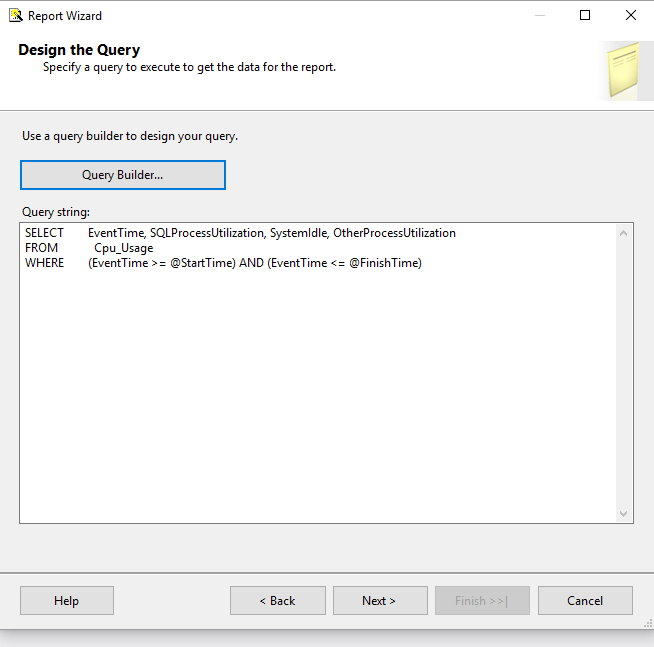
The query builder will appear. Enter the following Tsql code:
Script5 – SSRS CPU Report query.sql
Click ok.
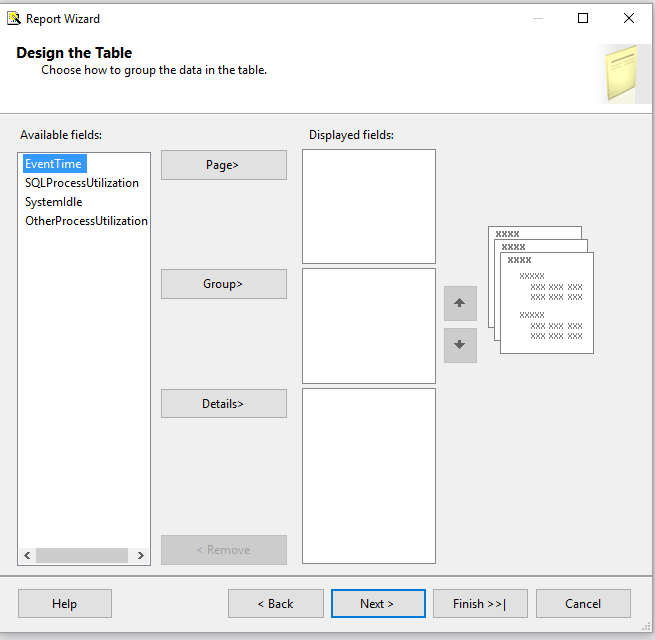
click next and choose Tabular shown below
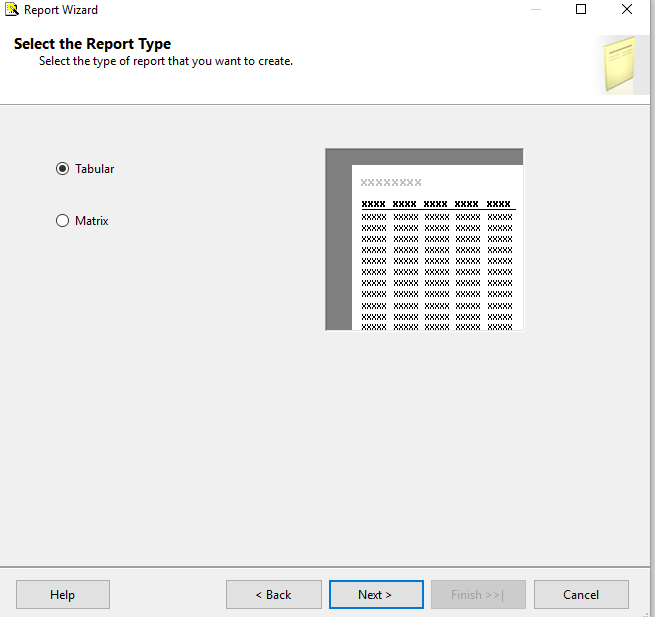
click Next.
click next.
In the Completing the Wizard section, under Report Name, give your Report an appropriate name and click Finish.
Under solution explorer under Reports you will see you newly created report and Visual studio will also have a menu on the left where we will now see our dataset along with the fields we created from our table. see below.
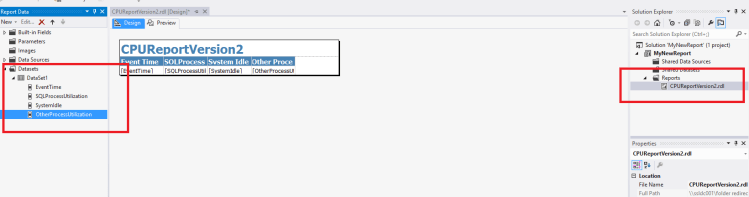
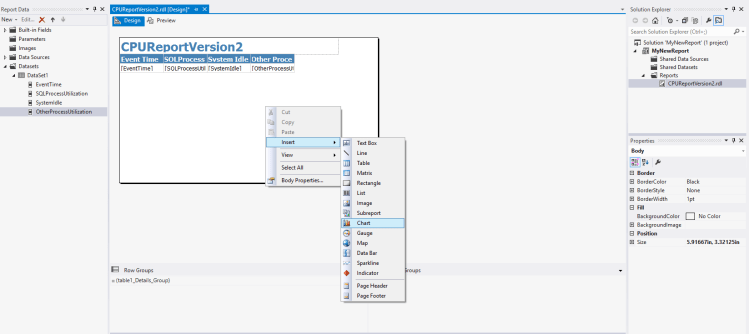
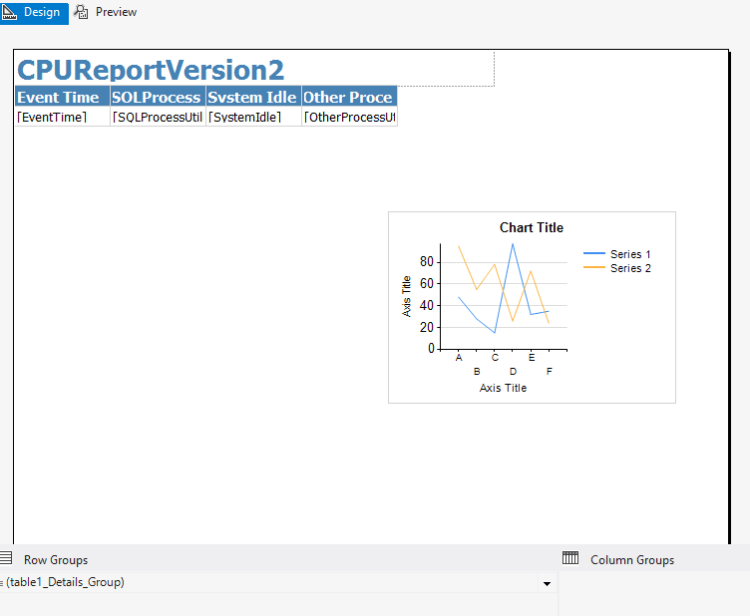
Next, within the report (making sure you are in the design view highlighted in blue above), right click and select insert – chart as shown below
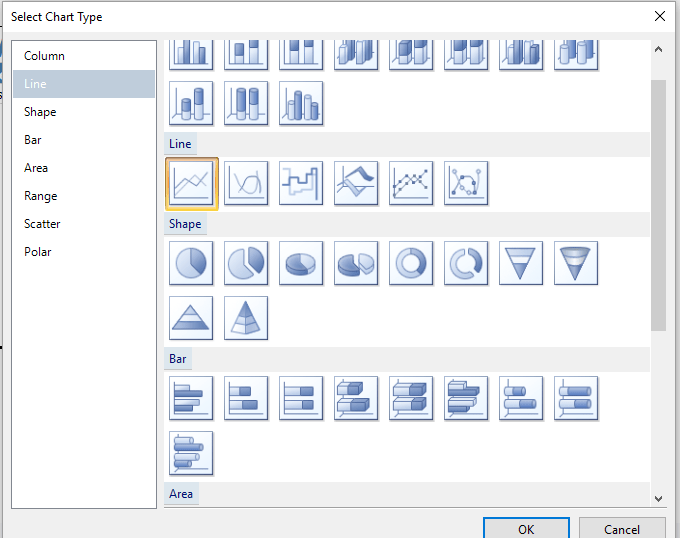
Then select the chart type of ‘Line’ selecting the first graph option as shown
Click ok then your graph will now appear within your report as shown.
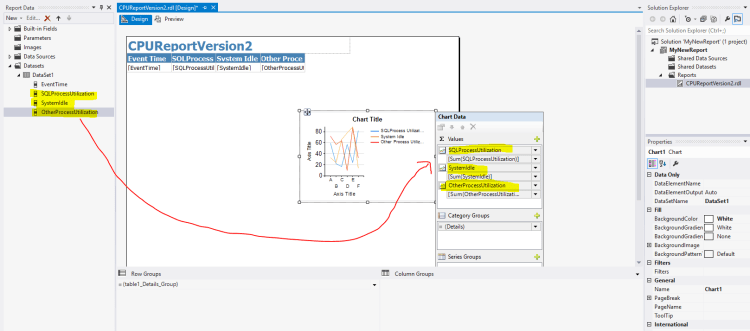
Click once within the new chart area, then click again and a new box should appear to the right hand side named ‘Chart Data’
We need to drag our DataSet column names from the left hand side of visual studio over into the Values box of the ‘Chart Data ‘box. So in our case we need to drag ‘SQLProcessUtilization’,’SystemIdle’ and ‘OtherProcessUtilization’ across as shown below. It should default to the SUM function.
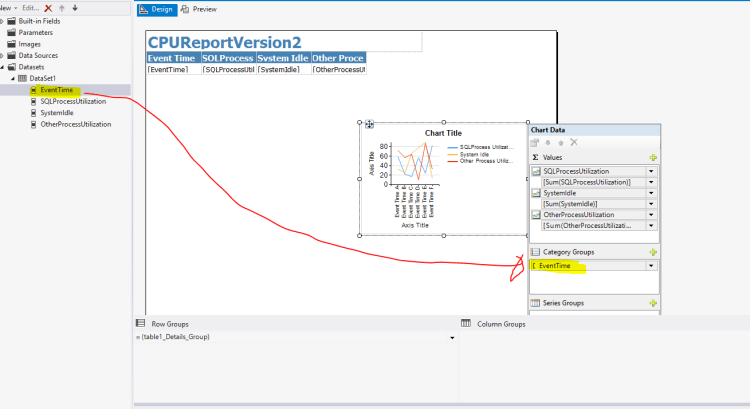
Next, right click in Category Groups within the ‘Chart Data’ box and delete category group if anything is currently there. We will now drag in the EventTime into this section as we did in the above section.
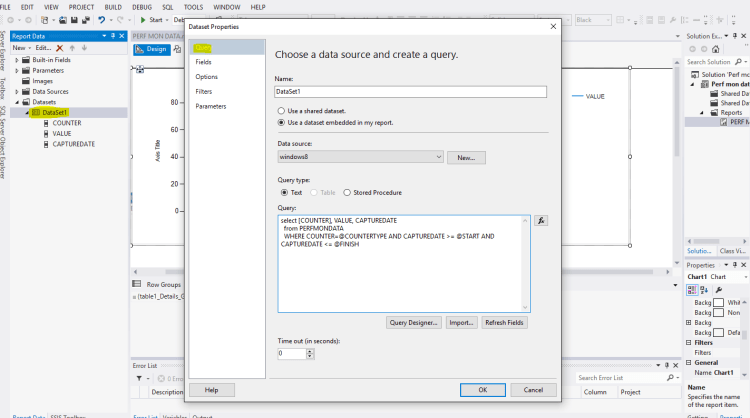
On the left hand side if you right click the dataset you created and choose Dataset Properties, the Dataset Properties dialogue box opens displaying our query.
Click on ‘Refresh Fields’ to make sure that we get our parameters populated in the parameters menu on the left hand side of visual studio as shown below:

Now we need to give the two variables @StartTime and @FinishTime a value of Date/Time.
Right click each one and select Parameter Properties, then within the General window, change the data type to Date/Time. You can enter anything you like for the Promt as this is what you will see for the date picker. Click ok once done.
Now you can delete the columns from the table report 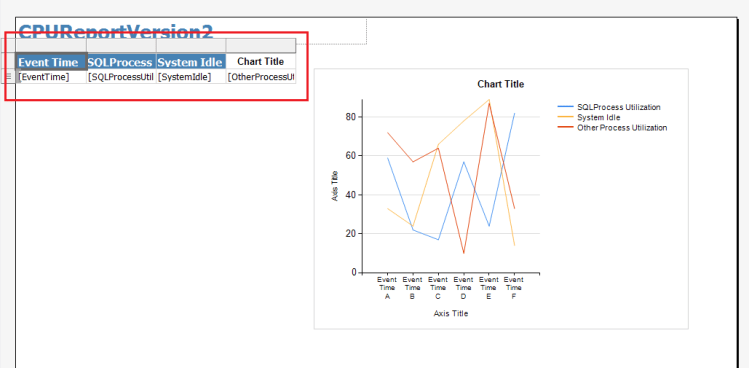
and finally resize your chart.
You can rename the axis and format them accordingly. You may find that if you select a large date range then you can not actually see the dates/times on the x axis as they will be too closely spaced. Once you identify a problematic time period however, you can then select a narrower date range to home in on the problem period.
To create a similar thing for the second table that we created ,called PerfMonData, and have the ability to choose the metric you wish to see data for, follow the same process as above, creating a separate project called ‘PerfMonData’.
The query for your report will look like the one below:
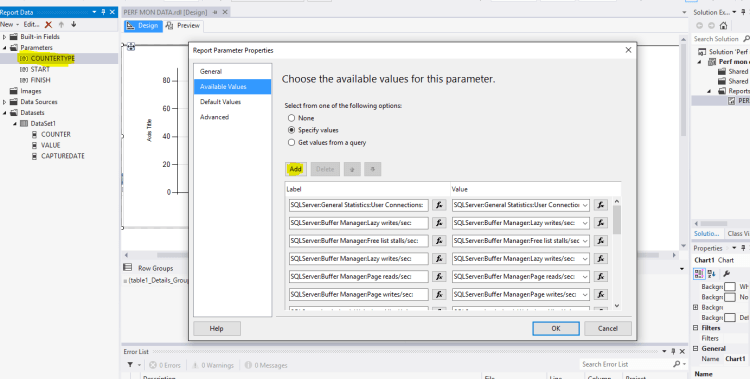
The only slight difference is how you configure the parameter @countertype. You have to give it the values that will be available for selection. I did it the following way:
Right click on the parameter properties and then from ‘Available counters’ click ‘Specify Values’ radio button then manually add the metrics you wish to report on. I just ran a
SELECT DISTINCT COUNTER
FROM PerfMonData
to get the list of metrics and just copy/pasted the ones I needed.
So there you have it. An easy way on how to capture some key sql metrics and then display the results in a graph format without breaking the bank.
You can now deploy the solution using SSRS where you can simply report on the data from your browser.
Even if you just collect the metrics into a table, then at least you will have some data to check against when you need to look at any changes in performance on your servers. You may have a better way on how to report on the data – as stated I am not an SSRS expert, but hopefully this shows you what you can do.
I hope you find this useful in some small way and please leave any comments.
Thanks for reading.

Hey thanks for this it has really helped me in reporting on my sql server metrics
LikeLike